Earlier this year we launched our new Agile Maturity Index (AMI) and began our five-part blog series focussing on the first four foundational pillars of an agile transformation; High Performing Teams, Process & Governance, Technology and Organisational Agility. In this fifth blog in the series, we’ll focus on the Culture of Innovation pillar.
There is a loose hierarchy to the index and, as a company matures across these areas, you would expect to see the impact of these improvements manifest themselves into a strong culture of innovation.
At the heart of this is a large organisation’s ability to draw innovative ideas from across the workforce and crucially, to enable these ideas to be rapidly delivered to market using an agile engineering capability, alongside analytics and data platforms that help them measure the efficacy of their output.
Speed and efficacy are the fundamentals of the agile manifesto and is what enables legacy businesses to operate more like their digitally native competitors.
Running on Workbench, the organisational insights platform developed by Temporall, the AMI allows us to surface data and draw insights about an organisation’s ideation processes. Their speed to market for new initiatives, not just their technical capability for continuous deployment which is very separate and the value that a business places on learning from outcomes is a key component of an agile organisation that has a strong innovation culture.
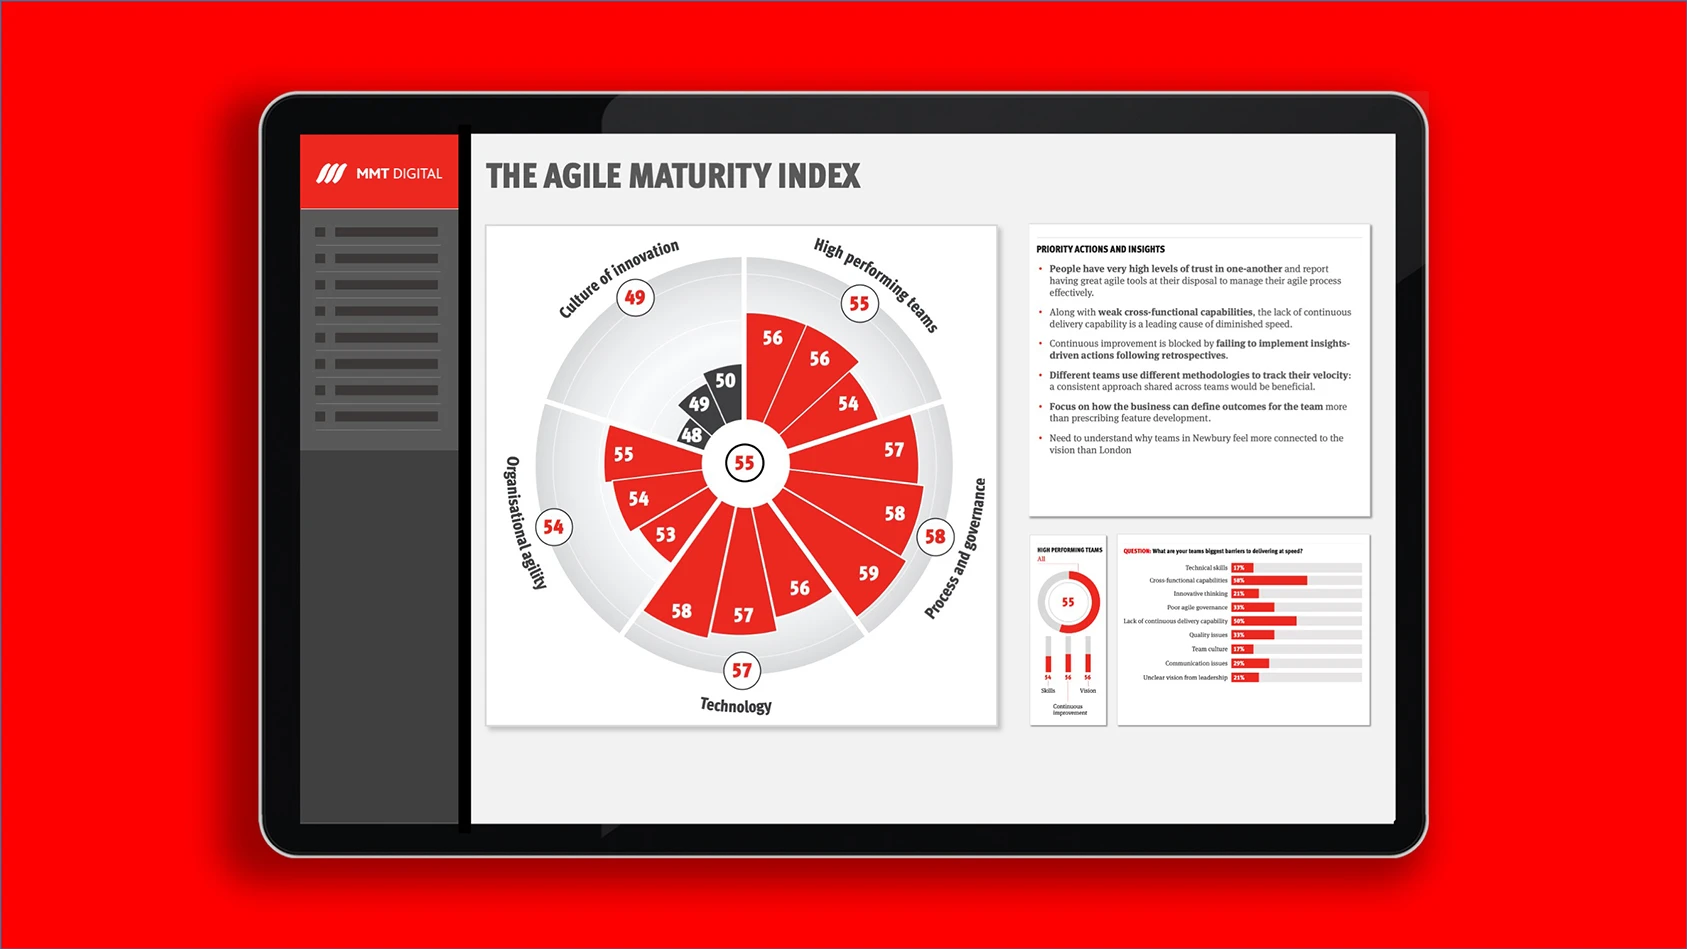
Starting with the high-level view of the AMI (below) we can immediately see that, for this organisation, the culture of innovation is the weakest overall area.
That is certainly common as it takes time for a newly transformed agile engineering capability to affect the culture of the organisation.
Drilling into the details of this macro-attribute shows us that although there are clearly a number of areas for improvement, the organisation is doing a reasonable job of creating a culture that values failed innovation (to some degree) where learnings can be drawn from it.
This is a key aspect of a culture of innovation so there are certainly some foundations that can be developed upon here.
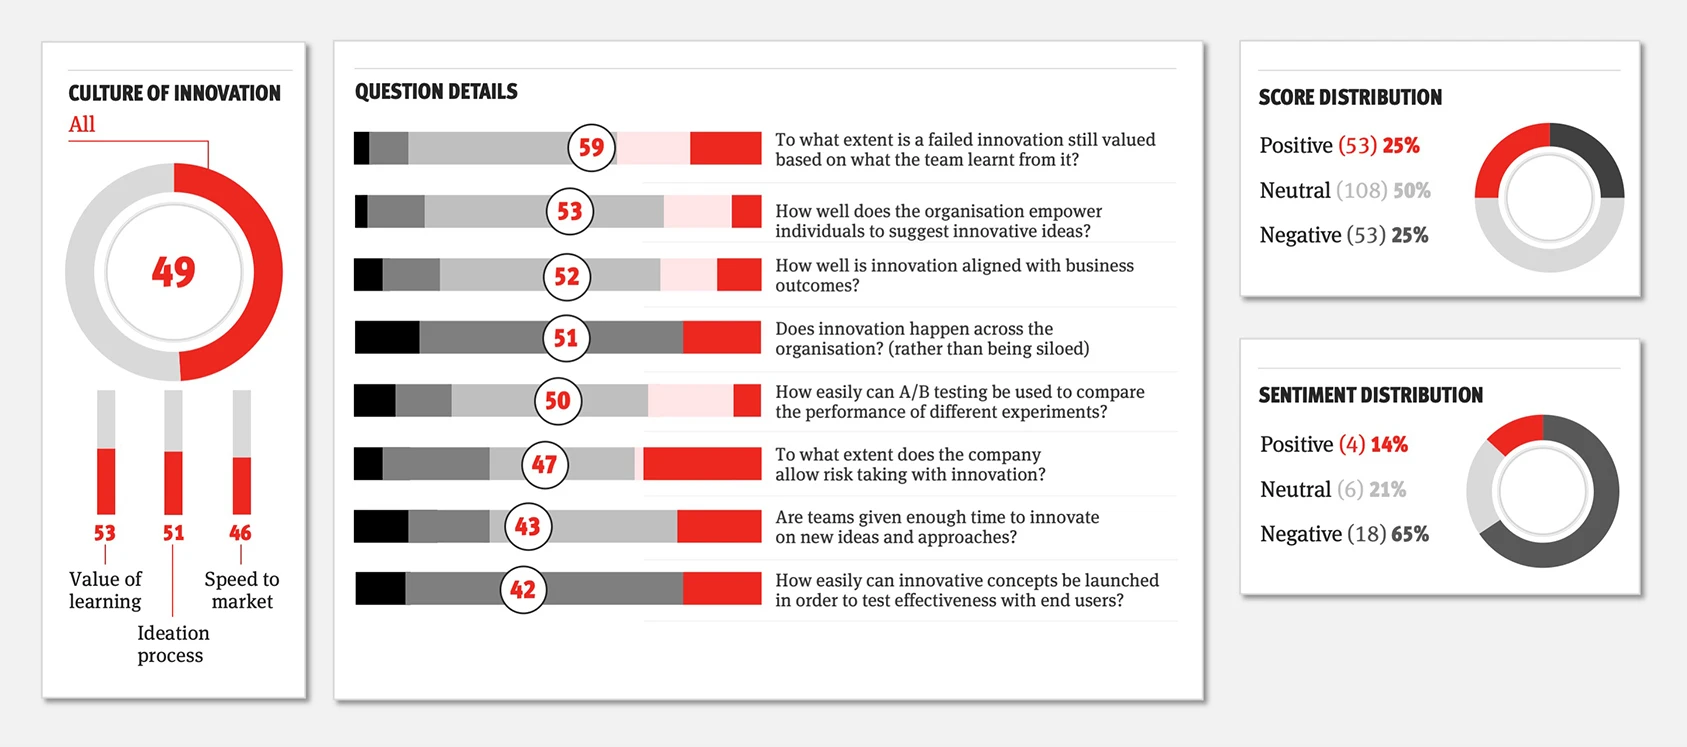
Whilst this is a weaker area from a quantitative point of view, in this example, this macro-attribute is also the lowest scoring in terms of team sentiment (derived from AI based analysis of the free text comments during the survey).
A lot of the comments provided mirror the wide spread of scores for most questions showing us that the culture of innovation is not coherent or consistent across the teams. This often causes friction (and negative sentiment) where certain teams feel that innovation is being done in silos whilst they struggle in this particular area.
Over time we can draw insights and actions from the quantitative data and the sentiment and look to improve both. An increase in the quantitative score across a macro-attribute often leads to an increase in positive sentiment which is strongly linked to a reduction in churn across an engineering team.
SPEED TO MARKET VS CONTINUOUS DELIVERY
The AMI also gives us the ability to plot data (quantitative and sentiment) across all 15 micro-attributes, giving another view across each macro-attribute. Here we can again see that our three micro-attributes within Culture of Innovation are relatively low scoring and whilst the sentiment around the company’s Ideation Process is fairly positive that is much less the case with both Speed to Market and Value of Learning:
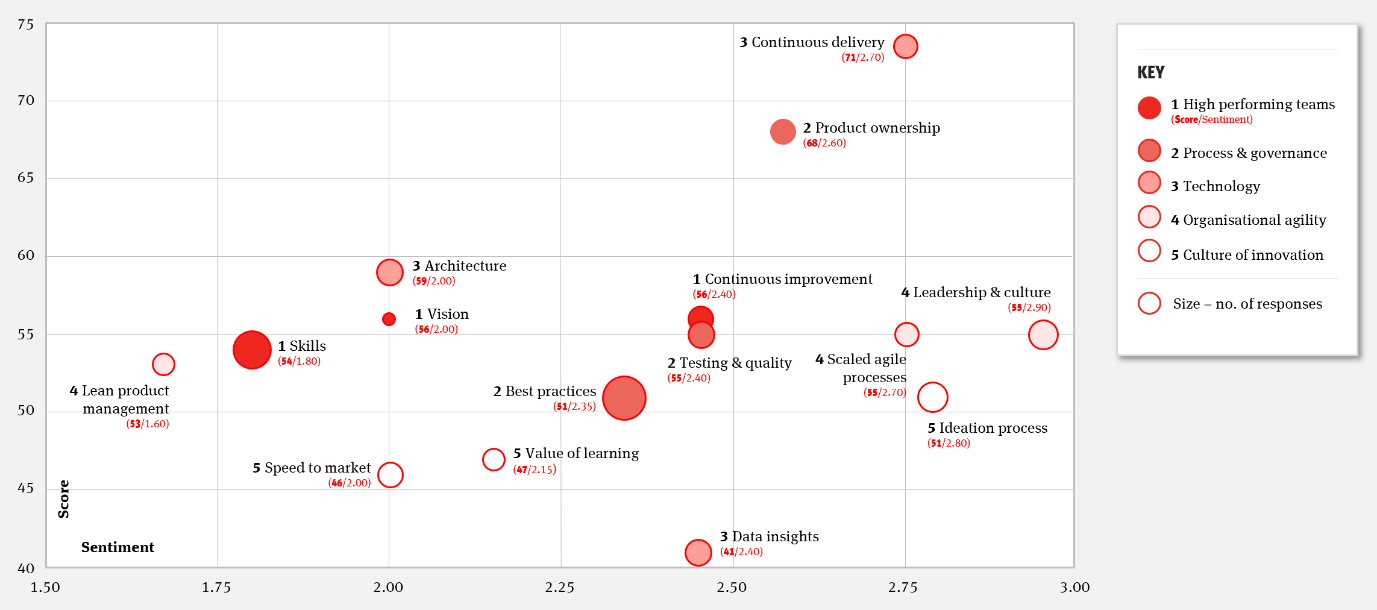
But what is particularly interesting here is the ability to show an organisation that their lack of organisational agility and relatively weak culture of innovation means that they are not able to capitalise on their strong agile engineering capabilities.
In the diagram above we can see that Continuous Delivery is the strongest micro-attribute and has one of the strongest sentiments from the team. This is a company that has invested in their technical capability to release multiple times a day to their customer facing web platforms.
However, despite a reasonably good ideation process there are clearly some major blockers in the ability to cut through company bureaucracy, decision making processes and risk management in order to bring these ideas to fruition.
As an organisation moves through an agile transformation this is a common pattern. The AMI is able to draw out this information, surfacing insights across teams to help an organisation alter behaviours that will gain the most benefit from this improved technical capability.
The COVID-19 pandemic has accelerated digital transformation at an incredible rate, with many organisations rapidly launching initiatives in April and May this year that would have taken months (possibly years) pre-2020.
Hopefully these learnings and behaviours will carry through, enabling a strong culture of innovation for those that have invested in modern, agile engineering practices and architectures. The AMI provides companies with the tools that they need to measure and refine those new behaviours and cultural shifts.
BREAKING DOWN INNOVATION SILOS
As noted above, the AMI allows us to see that there is no real consistent culture of innovation across this organisation. Scores and sentiment are broadly spread. This can often happen if certain teams or parts of the organisation are seen to be drivers of innovation (not in itself always a bad thing), without this culture filtering through the rest of the business.
One of the powerful features of the AMI is its ability to filter by role, department, region or office for example to drill into strengths and weaknesses in different parts of the organisation. Here we can see a simple filter showing the scores for this macro-attribute based on the team’s office locations:
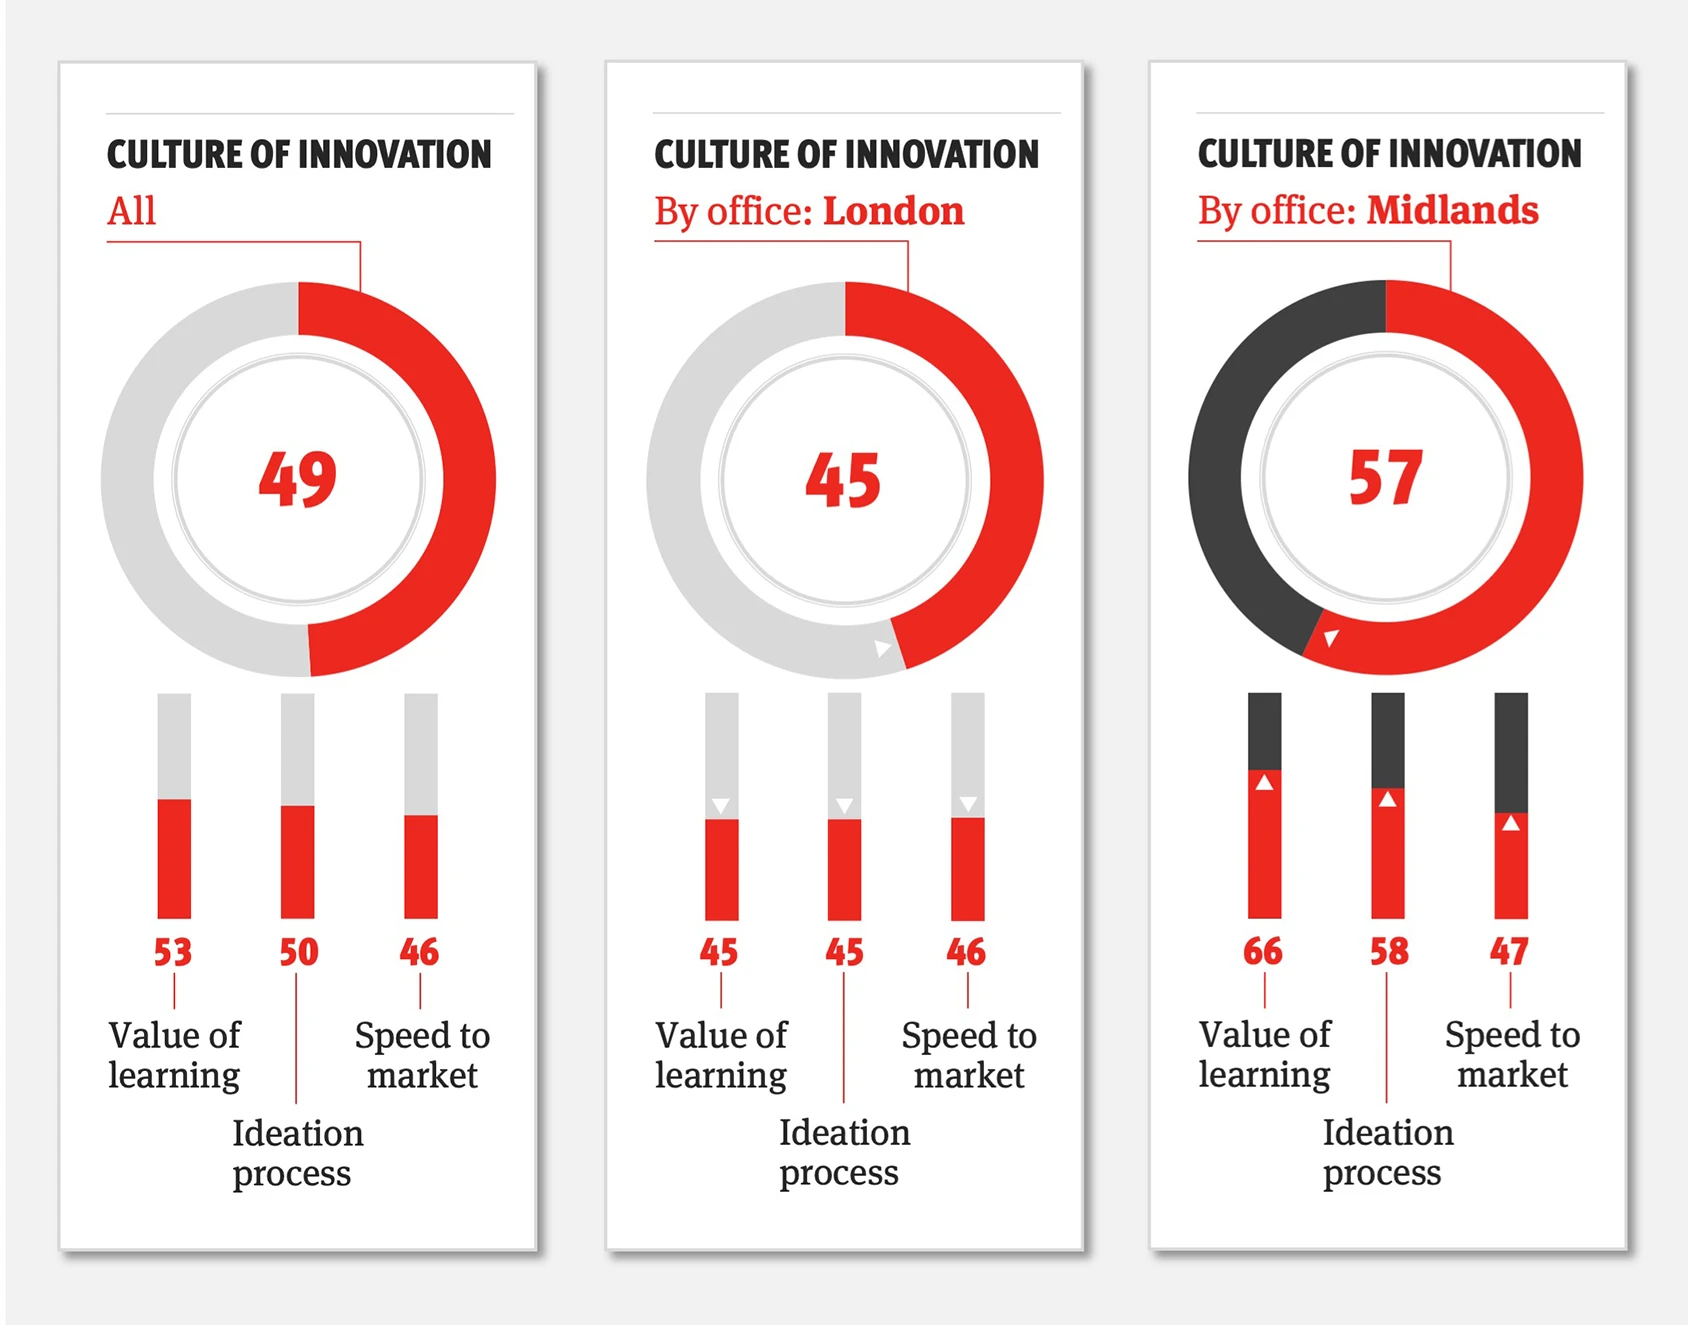
Speed to Market is consistently poor, and this is not unexpected. This is a scaled engineering team across multiple locations, but they are all working on the same platform. And Speed to Market is in some ways the ultimate agile marker and one that would be expected to improve consistently amongst teams that work on the same platforms.
However, we can see marked differences between these teams when it comes to their views on the idea processes and the perceived value that the business places on learning from experiments (even commercially unsuccessful ones). This enables us to drill into the comments and engage with these teams to find some quick wins that can be applied from one part of the organisation to another.
As with the analysis of Organisational Agility, one of the most interesting ways to filter the data for this macro attribute is by role - specifically looking at the differences in the perception across these areas from the senior leadership team in comparison to those within the agile teams themselves.
The AMI will often surface insights that show a marked difference between the leadership team’s perception of their culture and how that is reflected across the teams. That can often be a very powerful insight when it comes to introducing the changes to improve this.
We hope that you have enjoyed our five-part series on the AMI. There are some exciting new Systems Intelligence features being added to the Workbench platform. It will enable us to draw continuous insight across agile engineering teams through topic extraction and sentiment analysis of unstructured (and anonymous) conversations in Slack or Microsoft Teams. We will be releasing more information on those features soon.
If you’d like a demo or more information on how you can use the Agile Maturity Index to measurably improve your agile transformation, please drop me an email at james.c@mmtdigital.co.uk.


